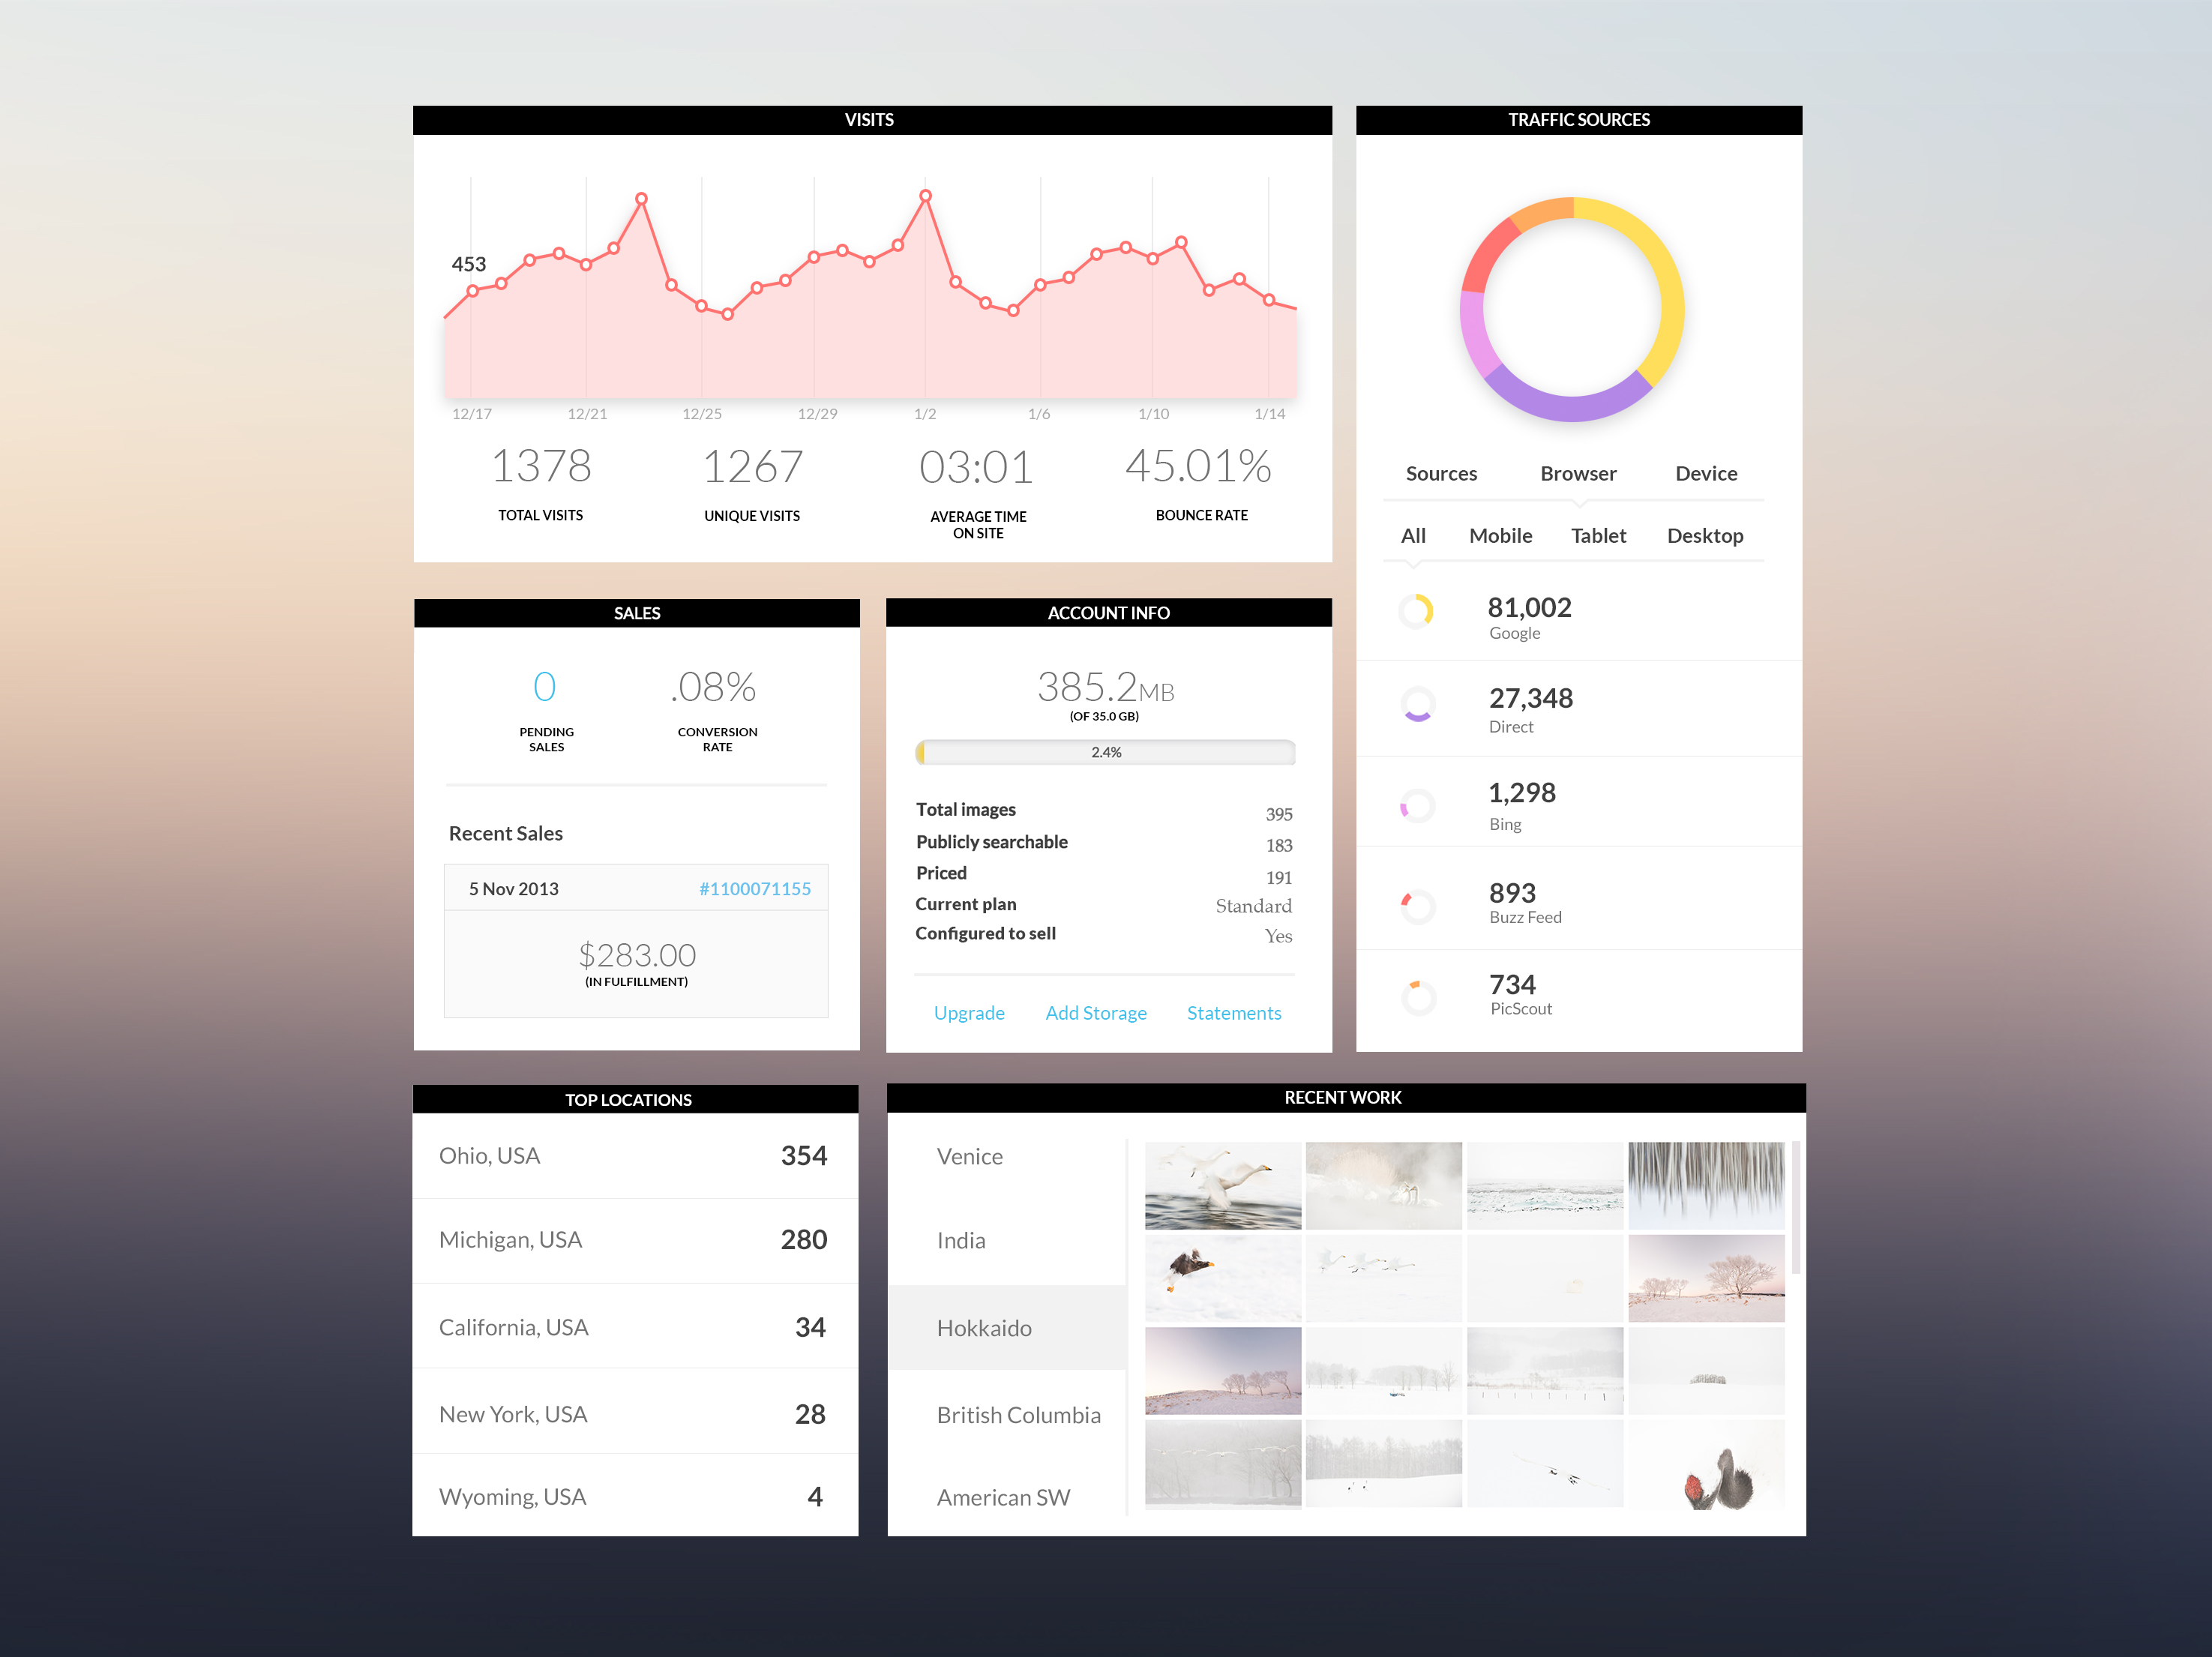
Building off the pre-established member homepage card designs, meant to work across a multitude of device sizes, the analytics area was the launch point for a wider set of initiatives intended to educate users about the impact of their images within our system and externally.
The project's loose guidelines provided ample room for me to consider what information we could display, and how to construct a flexible card system that could adapt to a wide range of analytics.
Top Traffic Sources
The 'Top Traffic Sources' card was intended to show how people are arriving at a photographer's website. Here are some early sketches I presented to the product team to help the team consider what information might be valuable to present, and how we might deliver this content:
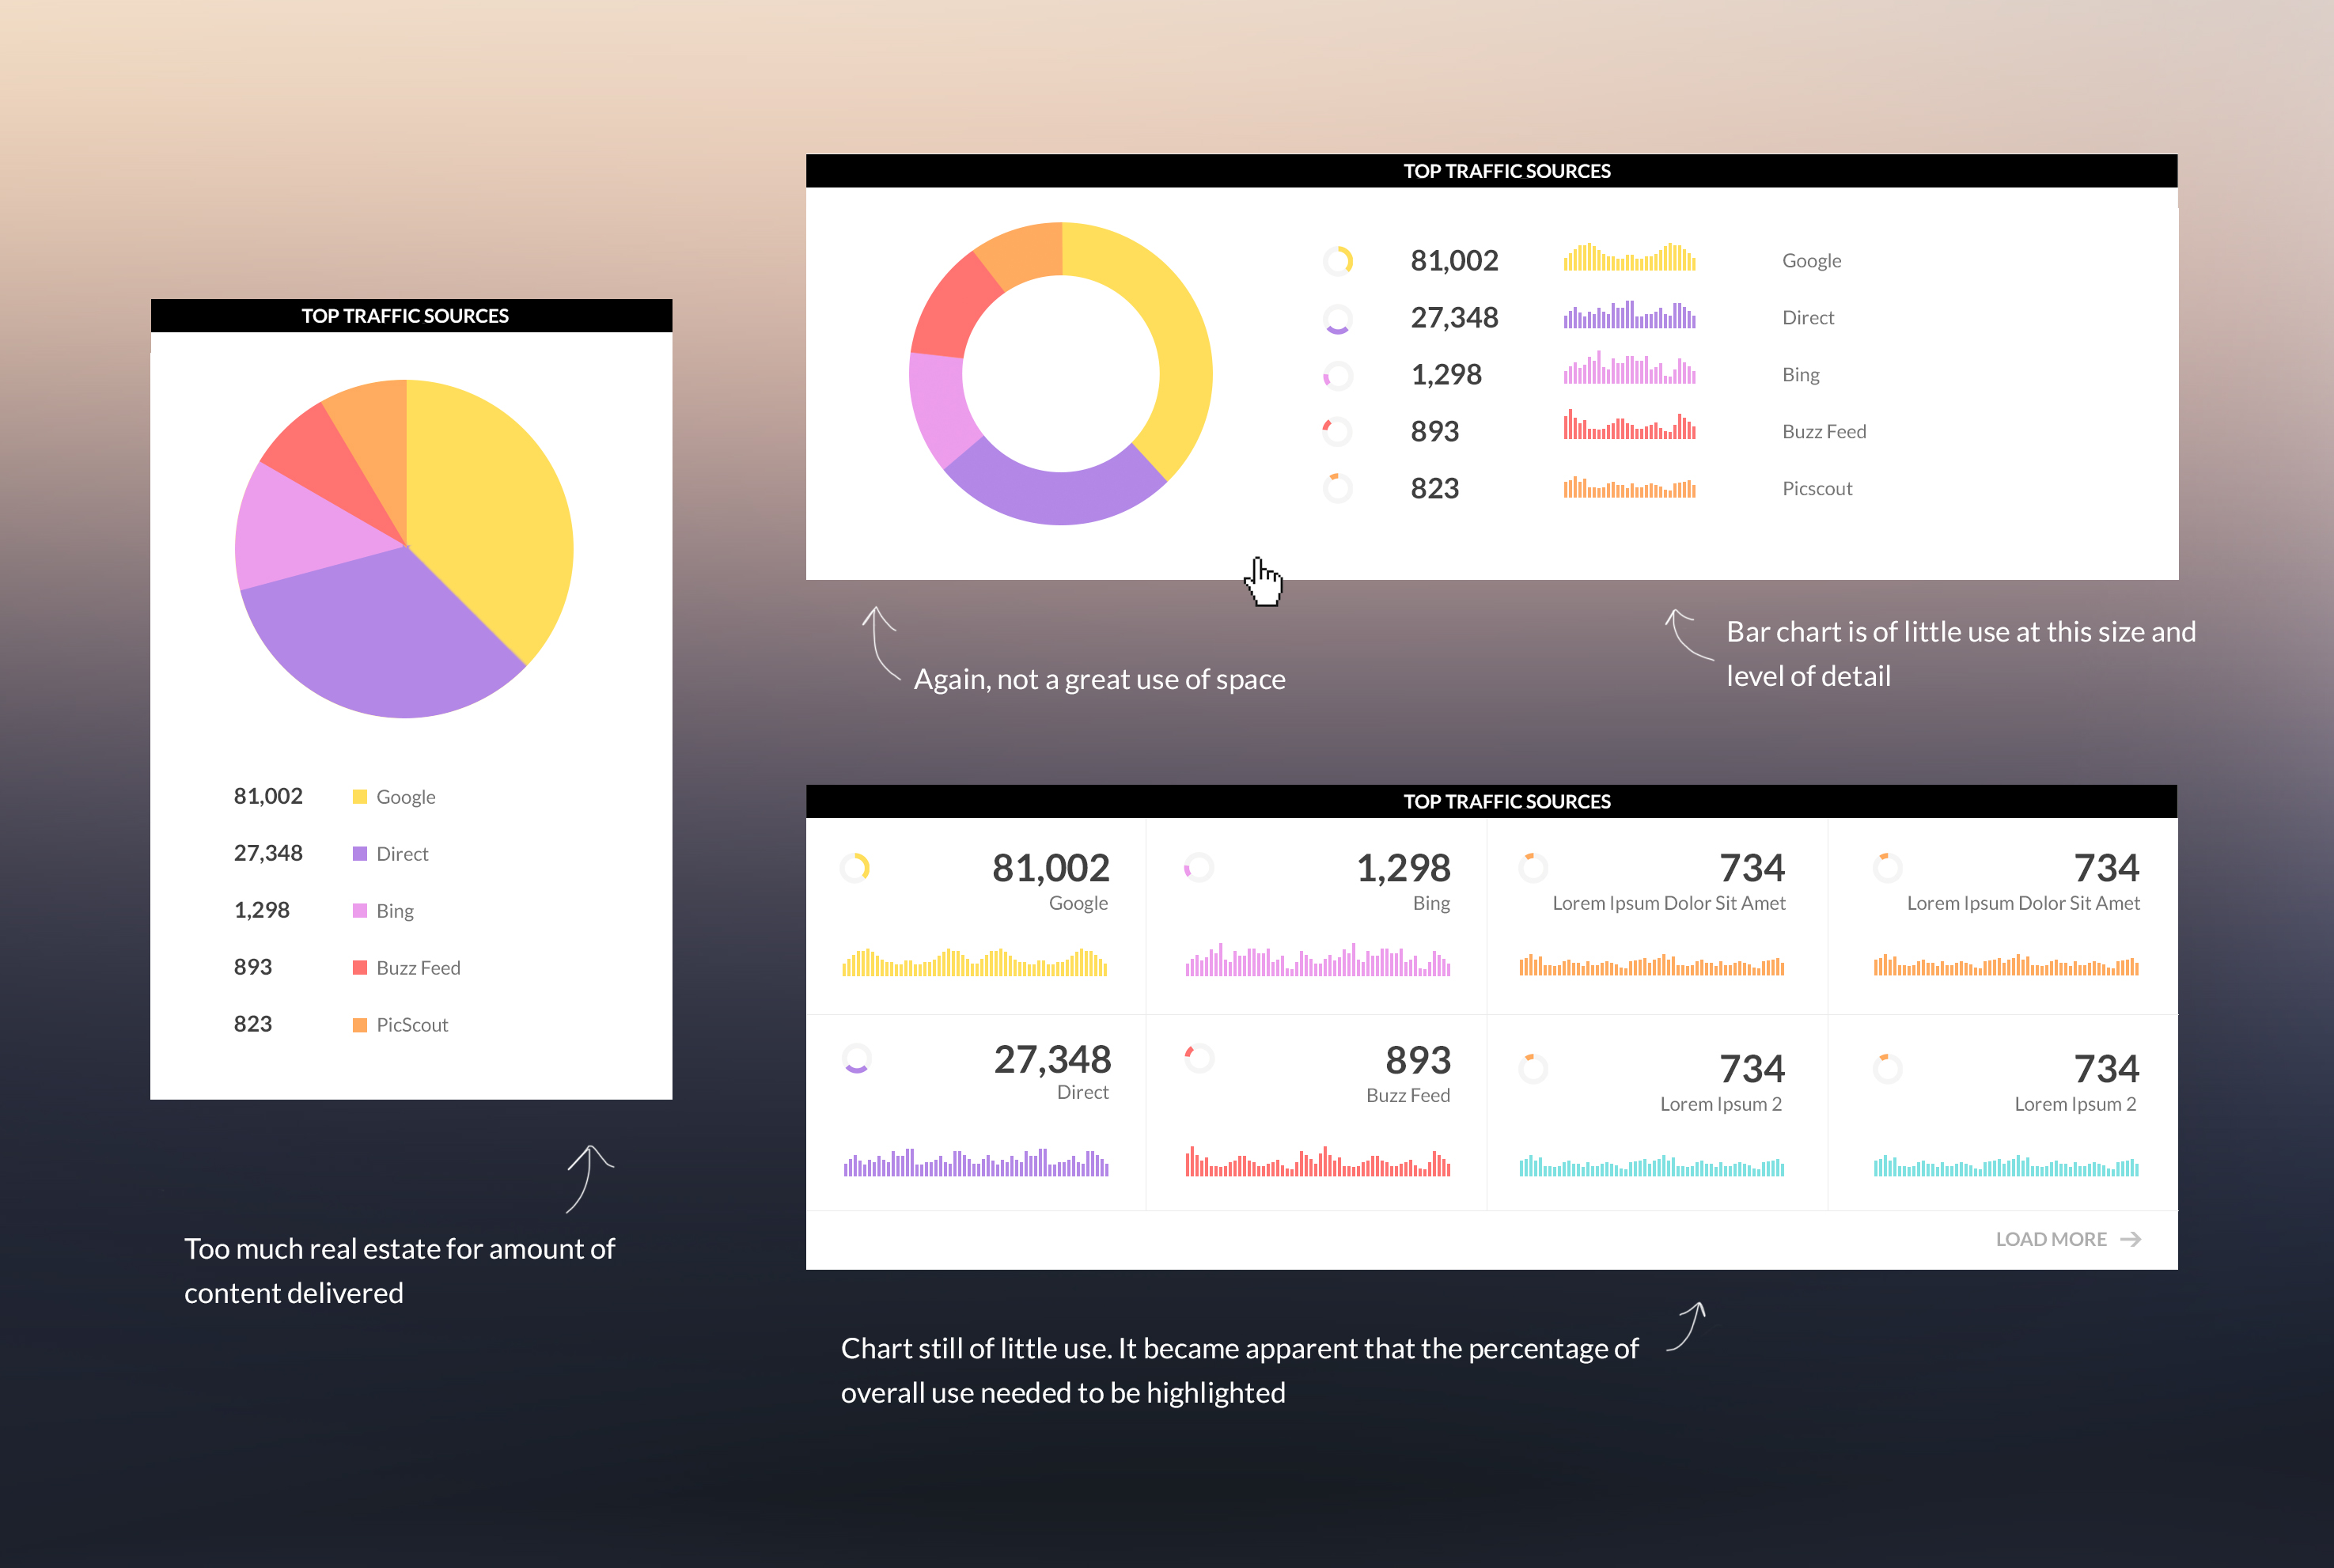
Traffic Sources card sketches
Below is the design we went with in the end. The design accommodated a large amount of content - top traffic sources, raw numbers and percentages, by source, browser and device - in minimal real estate.
Traffic Sources card final design
Recent Work
The "Recent Work"card was meant to encourage quick interaction with recently uploaded images. Although not entirely sketched out below, the idea behind this card was that additional quick actions (proof, send/share, view, price) could be added within this card on gallery or image hover.
Unique Visits
Many times design parameters are set via technical limitations. I explored many possibilities for an enriched Unique Visits interaction, including showing users a more detailed breakdown of unique visits on any particular day, when a day on the chart is clicked. Unfortunately, we were unable to pull this information from our system's database. Nonetheless, the presentation of the data below was a huge win for our users.
Final Unique Visits interactivity
No comments.